There are a number of packages available to visualisation networks in R - ranging from those which are implement other network analysis features to those which draw on the grammar of graphics visualisation techniques. This blog post demonstrates the differences between these packages for network visualisation - in terms of amount of code required, aesthetics etc.
Data
I will visualise the same network with each package. An International Trade Network (ITN), where the nodes are countries and the ties between them are trade. I will visualise this network with nodes coloured by the regional partition the country belongs to (for example, Europe, North America, East Asia & Pacific etc).
Edge and node size will be uniform (in most cases) and there will be no labels or legends in the plots.
The data is an igraph object, and is loaded from the ITNr package.
igraph
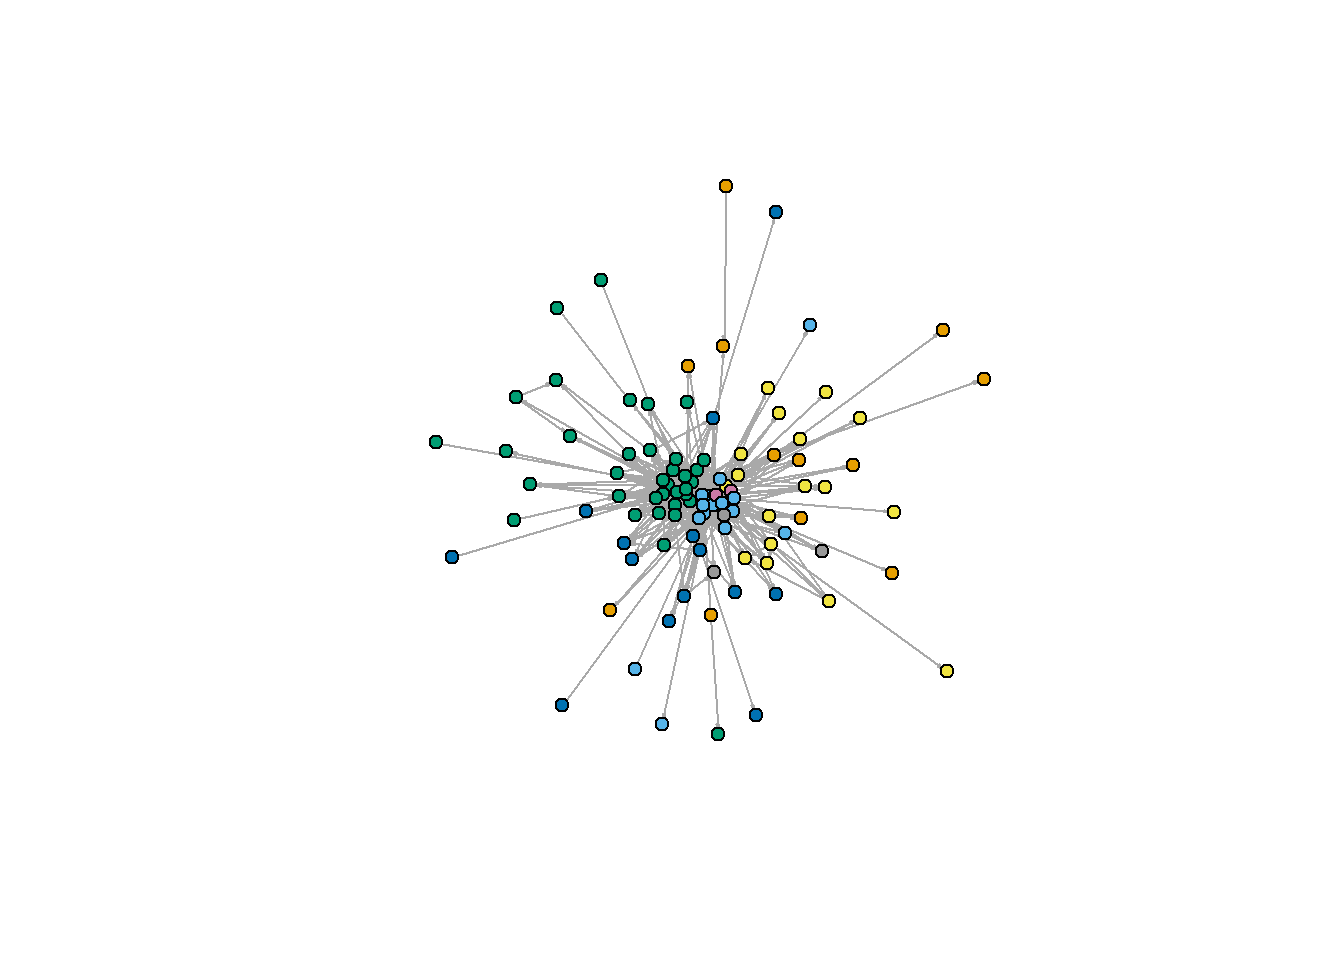
I will start with igraph, where this is a package widely used for social network analysis. This is a staple when using R for social network analysis, and often is the first approach used to plot a graph object quickly.
library(igraph)
library(ITNr)
data("ELEnet16")

plot(ELEnet16, edge.arrow.size=.1,
     vertex.label=NA,
     vertex.color=V(ELEnet16)$region,
     vertex.size=5
) 
Statnet
Another staple when using R for social network analysis is statnet. statnet suite of packages are also widely used for social network analysis, and implementing various models, chiefly the ERGM family of models.
library(statnet)
library(ITNr)
library(intergraph)

data("ELEnet16")

net<-asNetwork(ELEnet16) # Convert to a network object

plot(net, vertex.col = "region",
     vertex.cex=2,edge.col="grey")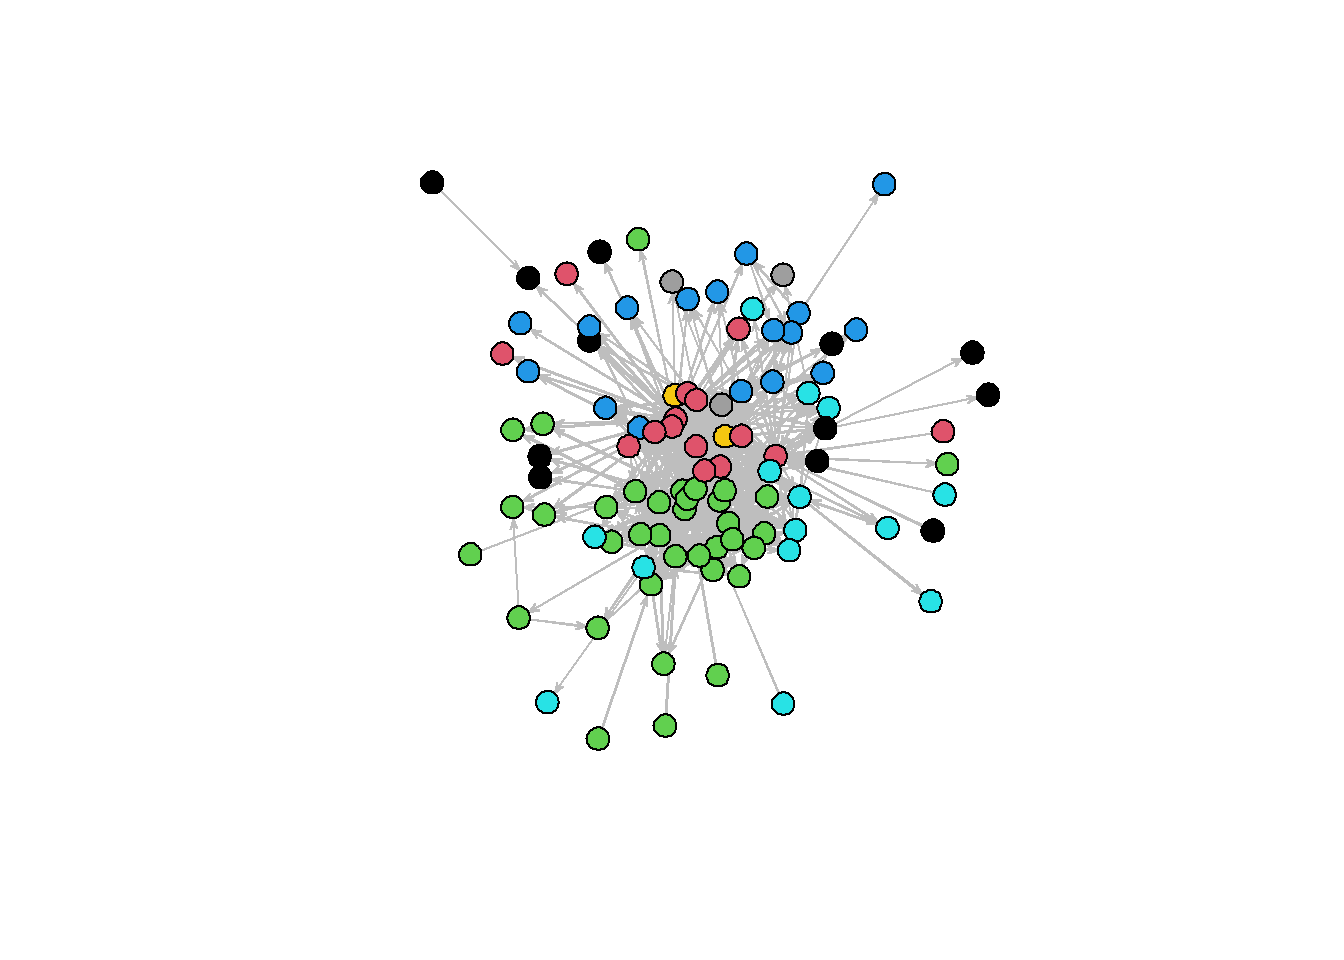
ggnetwork
ggnetwork allows you to draw on ggplot2 capabilities for network visualisation. This is very useful for people who frequently use ggplot2 for other visualisation. Furthermore, as it is aligned with ggplot2 it is very flexible and can be used to create bespoke visualisations (such as the example found here).
library(ggnetwork)
library(ITNr)
library(intergraph)

data("ELEnet16")

net<-asNetwork(ELEnet16) #ggnetwork requires a network object
n<-ggnetwork(net)

ggplot(n, aes(x = x, y = y, xend = xend, yend = yend)) +
  geom_edges(color = "grey50") +
  geom_nodes(aes(color = as.factor(region),size=4)) +
  guides(color=FALSE,size=FALSE)+ #Remove legends
  theme_blank()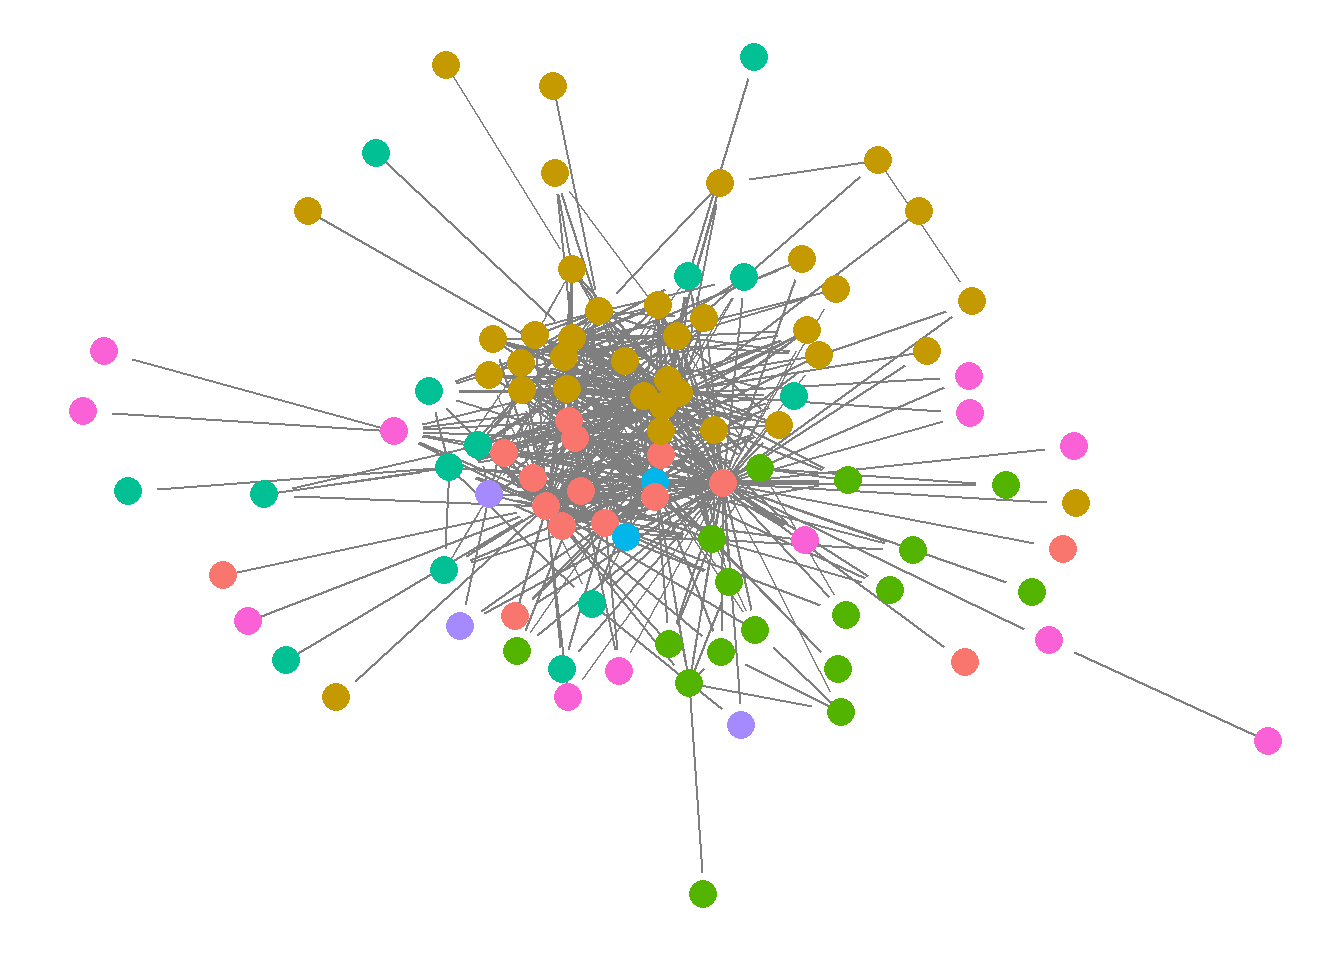
ggnet
ggnet is part of the GGally package. This is another package that allows to plot network objects as ggplot object. Yet is not as closely aligned with ggplot (in terms of commands and syntax) as ggnetwork.
library(GGally)
library(intergraph)
library(ITNr)
data("ELEnet16")

net<-asNetwork(ELEnet16) #ggnet requires a network object

ggnet2(net, node.size = 6,
       node.color = "region",
       edge.size = "weight", edge.color = "grey")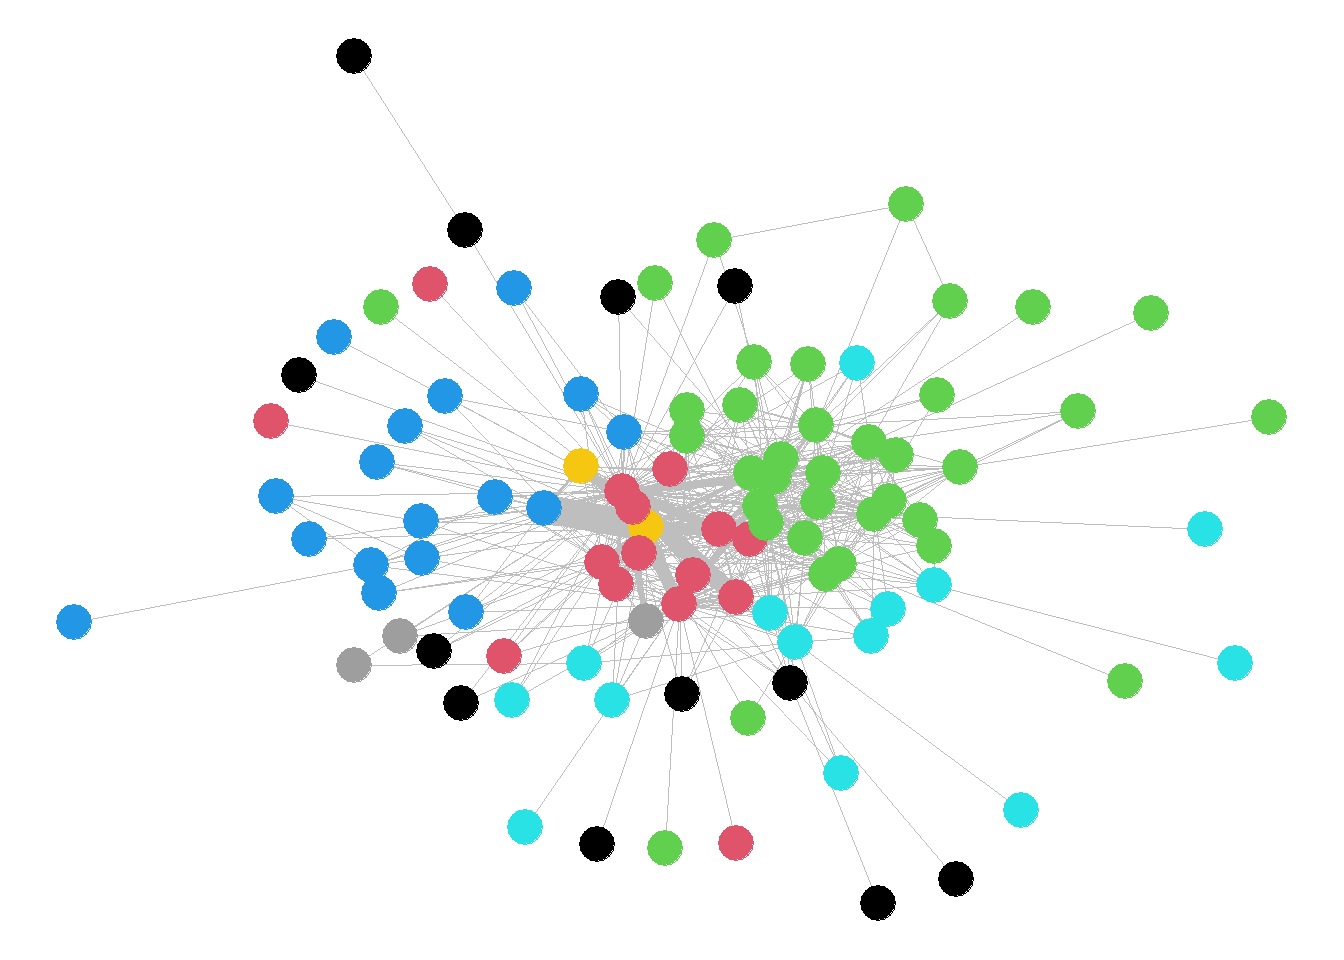
Networks & Plotly
The plotly graphing library in R allows you to make interactive, publication-quality graphs online. This library can also be used to plot networks, to make interactive online network visualisations.
Update: There was a bug in the previous version. Many thanks to Daniel Kiser for highlighting this and providing the solution. 👍
library(plotly)
library(igraph)
library(ITNr)

data("ELEnet16")

vs <- V(ELEnet16) #Get node list
es <- as.data.frame(get.edgelist(ELEnet16)) # Get edgelist
node.data<-get.data.frame(ELEnet16,what="vertices") # Get node attribute dataframe

Nv <- length(vs) #number of nodes
Ne <- length(es[1]$V1) #number of edges

#Coordinates for nodes
L <- layout.fruchterman.reingold(ELEnet16)
Xn <- L[,1]
Yn <- L[,2]

#Creates the nodes (plots the points)
network <- plot_ly(x = ~Xn, y = ~Yn, #Node points
                   mode = "markers",
                   text = vs$name,
                   hoverinfo = "text",
                   color =as.factor(node.data$region) )

#Create edges
edge_shapes <- list()
names(Xn) <- names(vs)
names(Yn) <- names(vs)
for(i in 1:Ne) {
  v0 <- as.character(es[i,]$V1)
  v1 <- as.character(es[i,]$V2)

  edge_shape = list(
    type = "line",
    line = list(color = "gray", width = 0.3),
    x0 = Xn[v0],
    y0 = Yn[v0],
    x1 = Xn[v1],
    y1 = Yn[v1]
  )

  edge_shapes[[i]] <- edge_shape
}


axis <- list(title = "", showgrid = FALSE,
             showticklabels = FALSE, zeroline = FALSE)

p <- layout(
  network,
  title = 'Networks & Plotly',
  shapes = edge_shapes,
  xaxis = axis,
  yaxis = axis,
  showlegend=FALSE
)
p
ggraph
ggraph - the Grammar of Graph Graphics, was created by Thomas Lin Pedersen, who has also authored the tidygraph package, that applies the tidyverse philosophy to social network analysis.
library(igraph)
library(ggraph)
library(ITNr)

data("ELEnet16")

ggraph(ELEnet16) +
  geom_edge_fan(alpha=0.5) +
  geom_node_point(
    aes(color=as.factor(V(ELEnet16)$region),size=2),
    show.legend = FALSE)+
  theme_graph()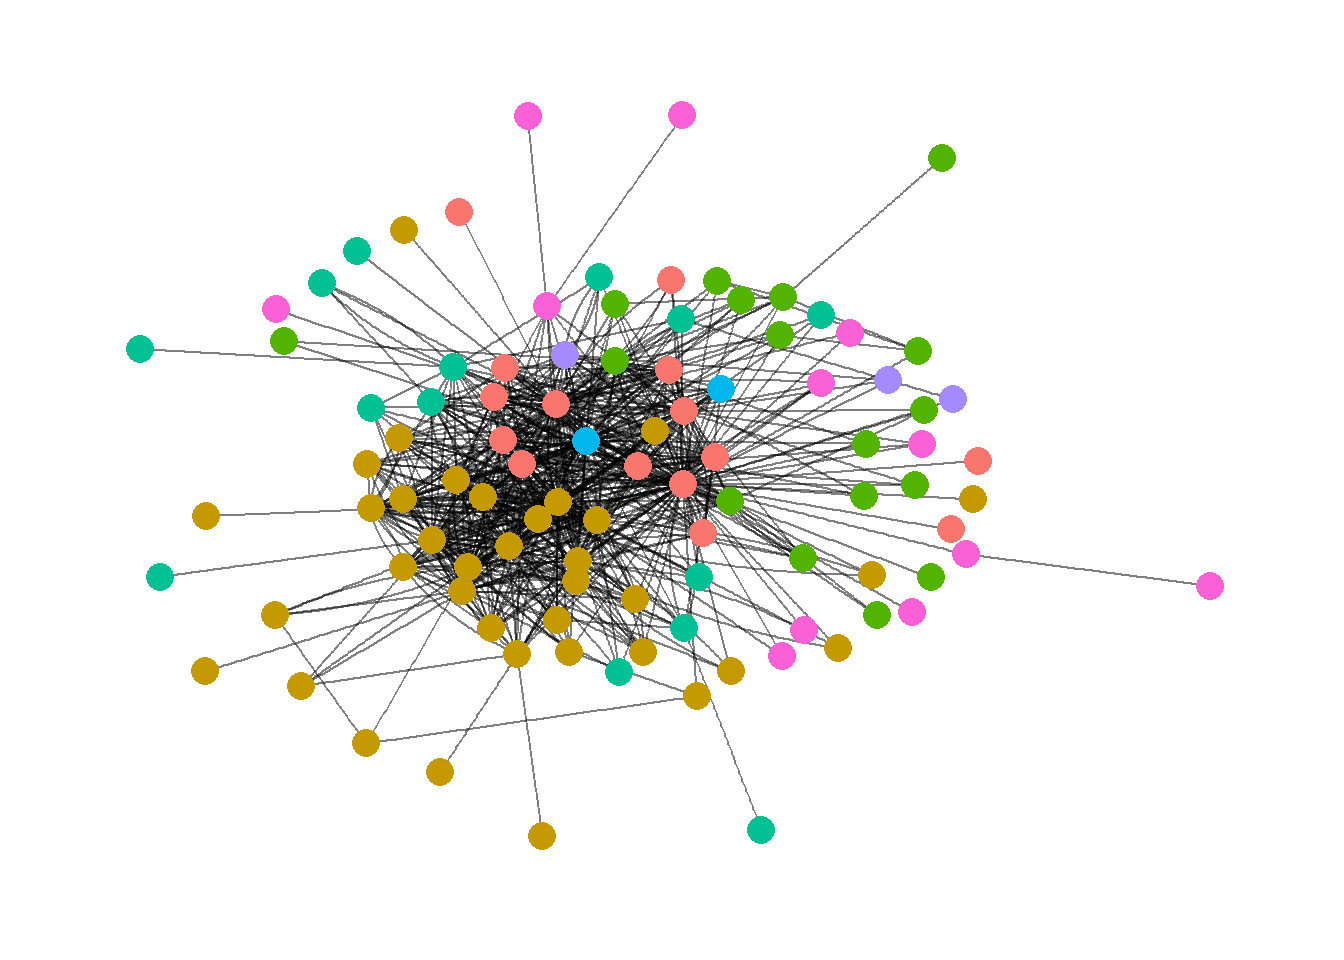
Evaluation
Here some of my final thoughts on the various visualisation tools (my personal opinion). My favourite is ggnet - as it provides a nice and clean visualisation, with minimal code required. Where the options to change node/edge colour, size and shape are very clear.
ggnetwork is a close second, and is a great tool for visualising networks (and creating custom plots) if you are familiar with the ggplot commands. However, if you don’t use these frequently, one of the other packages may be more suitable.
The output and code for the ggraph package shares some similarities with ggnetwork, where both seem to use a variant of the ggplot syntax. However, for standard network visualisation, I personally prefer ggnetwork to ggraph. ggraph provides a nice, aesthetically pleasing visualisation, however, its strengths lie in different types of visualisation plots of network it can produce (rather than simply a standard plot), such as hive plots, hierarchical layout plots, dendrogram and much more.
The staples of social network analysis in R, igraph and statnet, offer quick visualisations. These are good for a quick exploratory inspection of the network but are not necessarily the most aesthetically pleasing.
Plotly provides a tools to create nice interactive visualisation, but requires substantially more data processing compared to the other packages.